Upload exam scores.
Get the answers hidden in them.
SmartGrader reads your Excel sheets and turns them into dashboards, class comparisons, and student-level insights — in the time it takes to make coffee.
A struggling student is visible in the data weeks before anyone notices.
- Term ends. 12 teachers send 12 spreadsheets in 12 different shapes.
- Someone spends the weekend copying rows into one master sheet.
- By the time you spot the kid failing three subjects, it's June.
- The board asks for a comparison. You build one from scratch, again.
- Teachers drag in the same .xlsx they always send.
- Every class, subject, and term rolls up automatically.
- At-risk students land on page one — week two, not week twelve.
- Board report is one click. Formatted. Done.
Three steps between a spreadsheet and a decision.
Create your school
Sign up as an admin, set your grading scale, and invite your teachers by email. No IT project required.
Upload the Excel you already have
Teachers drag in their end-of-term spreadsheet. SmartGrader reads columns, matches students, and stores the term.
Read the results
Dashboards, subject breakdowns, and top / bottom performers appear the moment the upload finishes. Export to Excel any time.
See how SmartGrader transforms your data.
From raw spreadsheet uploads to interactive school-wide analytics and unified student dashboards.
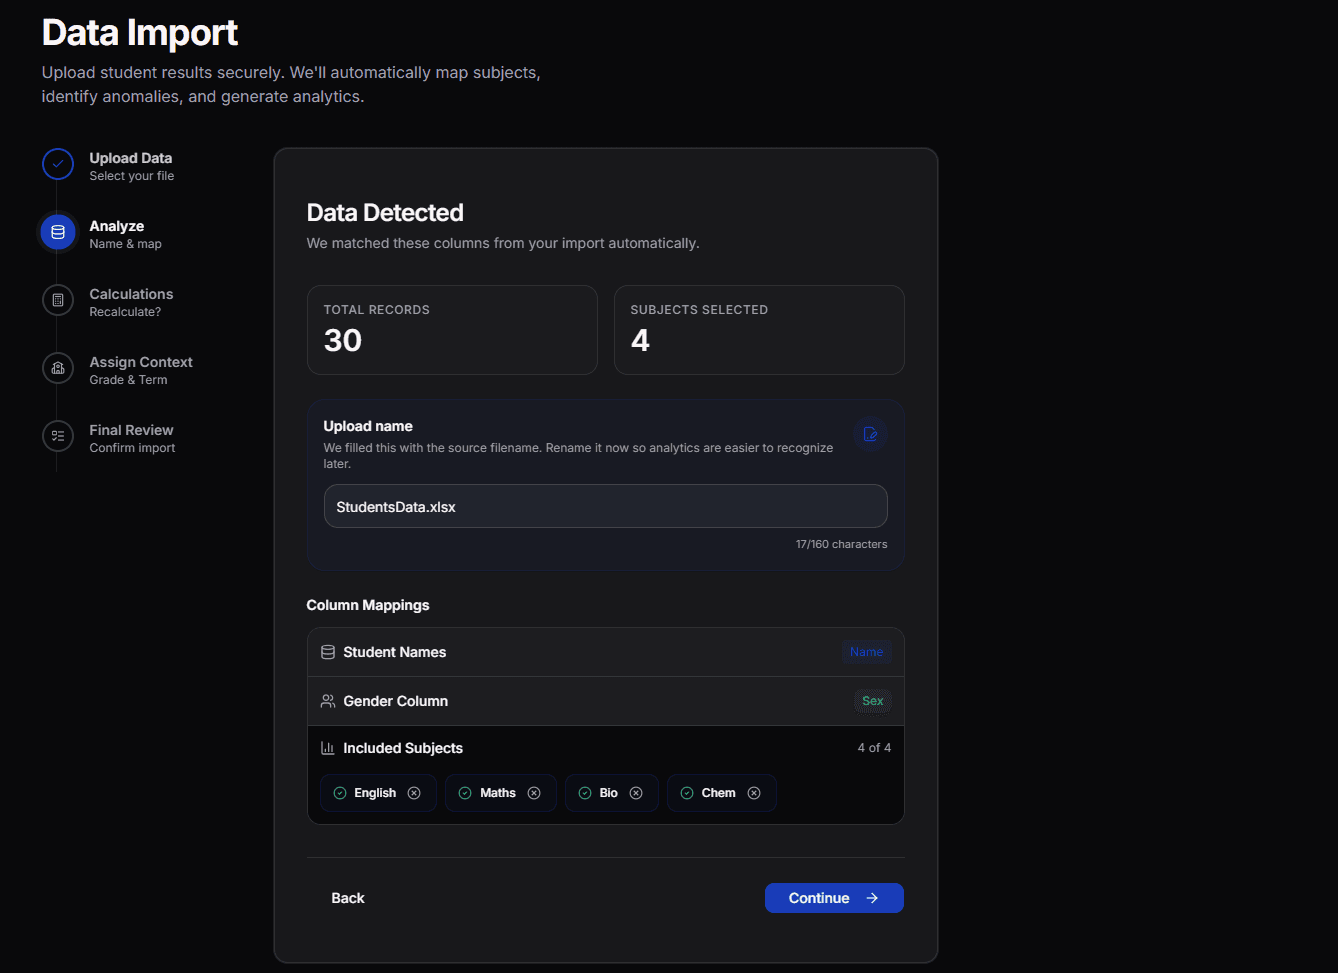
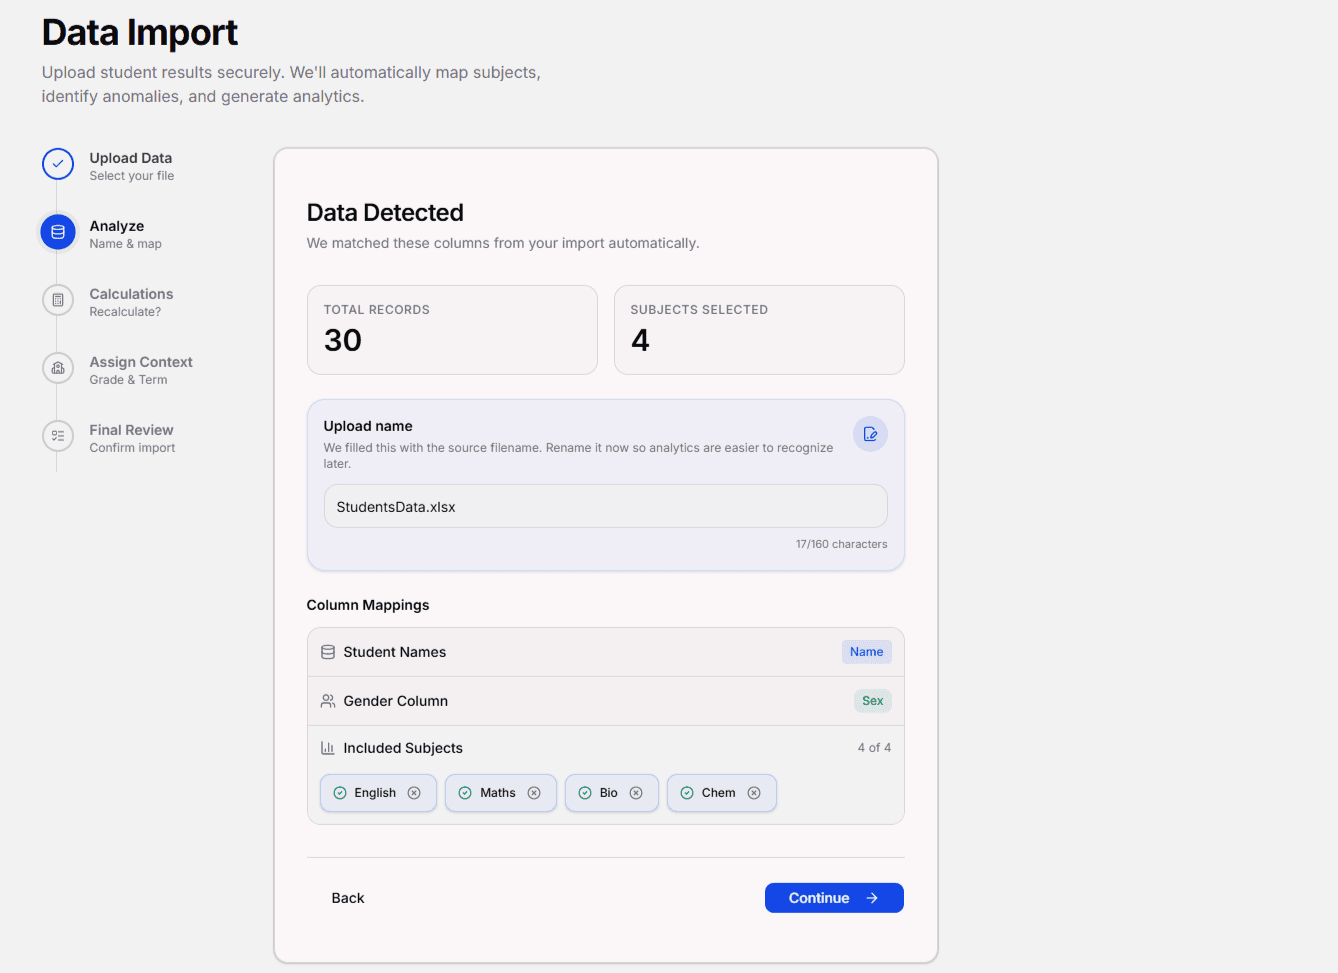
Drag, drop, and auto-map columns.
Forget manual reformatting. Teachers upload the exact Excel sheets they already use. SmartGrader automatically detects student names, matches columns to subjects, and highlights any data anomalies instantly.
- Auto-detects student names and subjects
- Validates data formats and flags empty rows
- Processes multi-subject sheets in under 5 seconds
Dynamic dashboards without pivot tables.
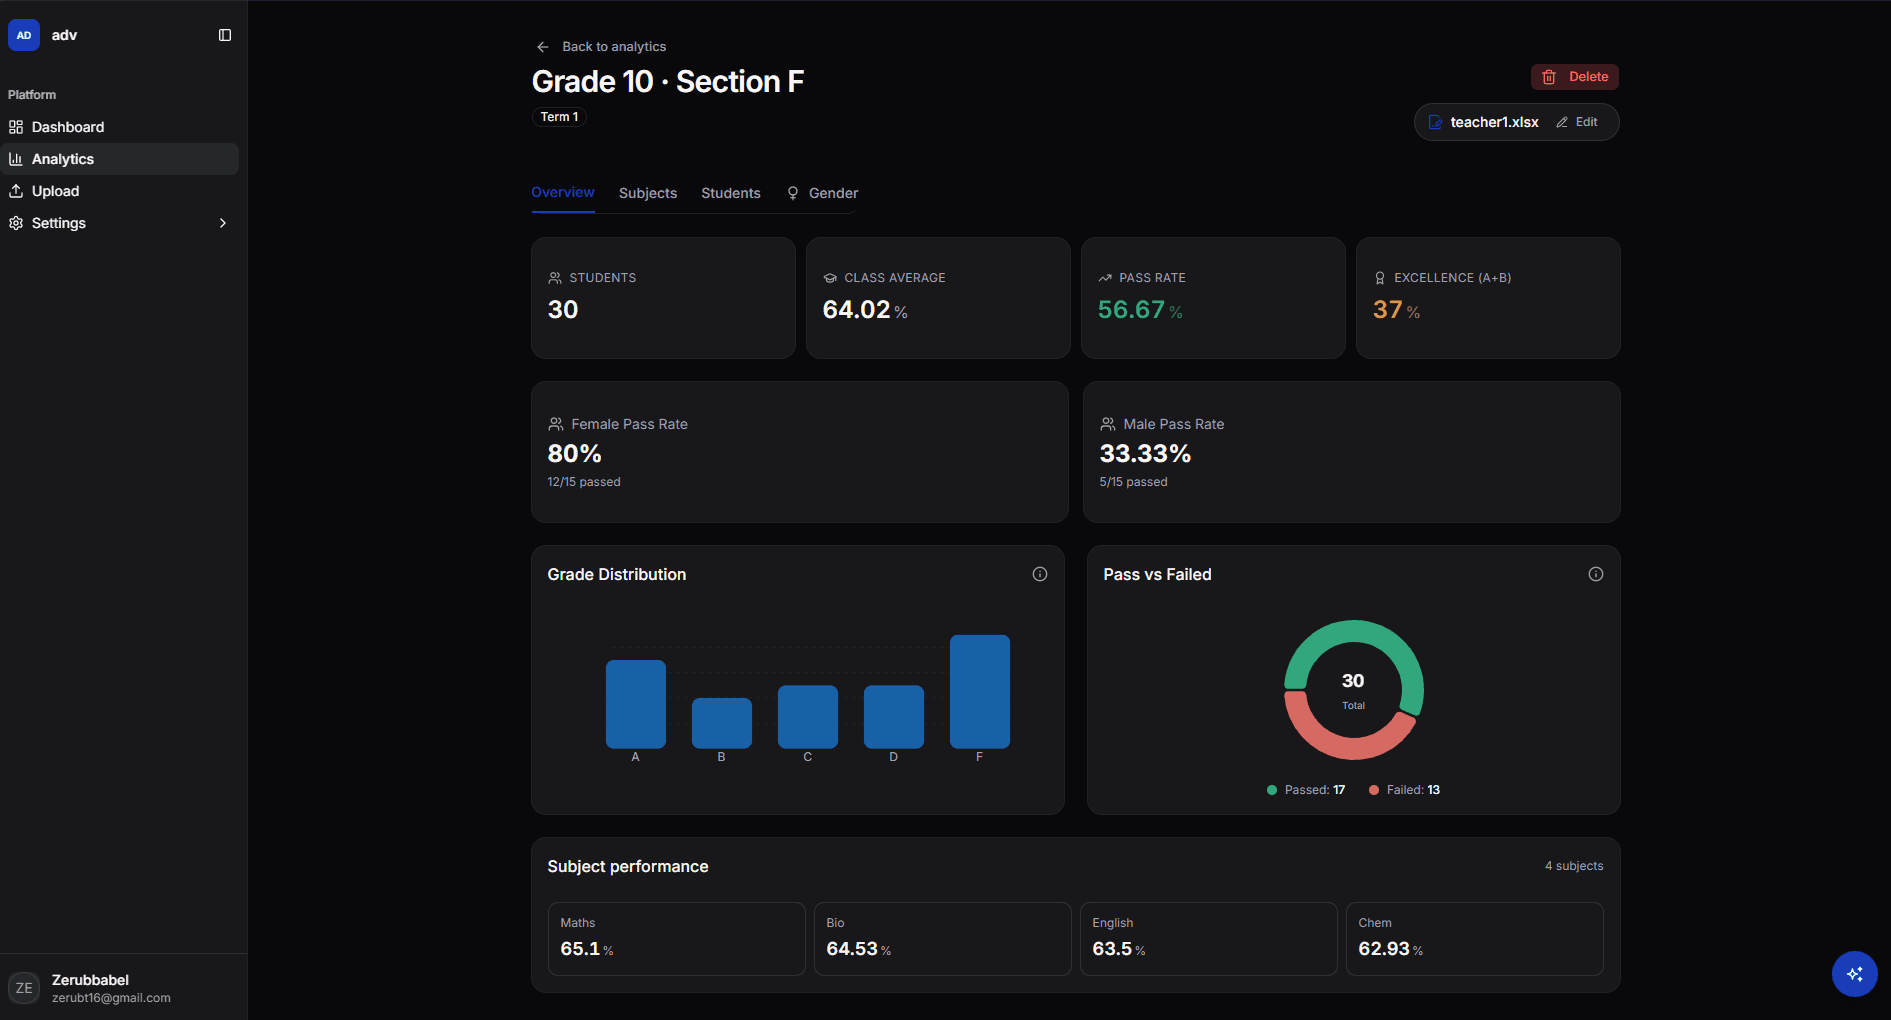
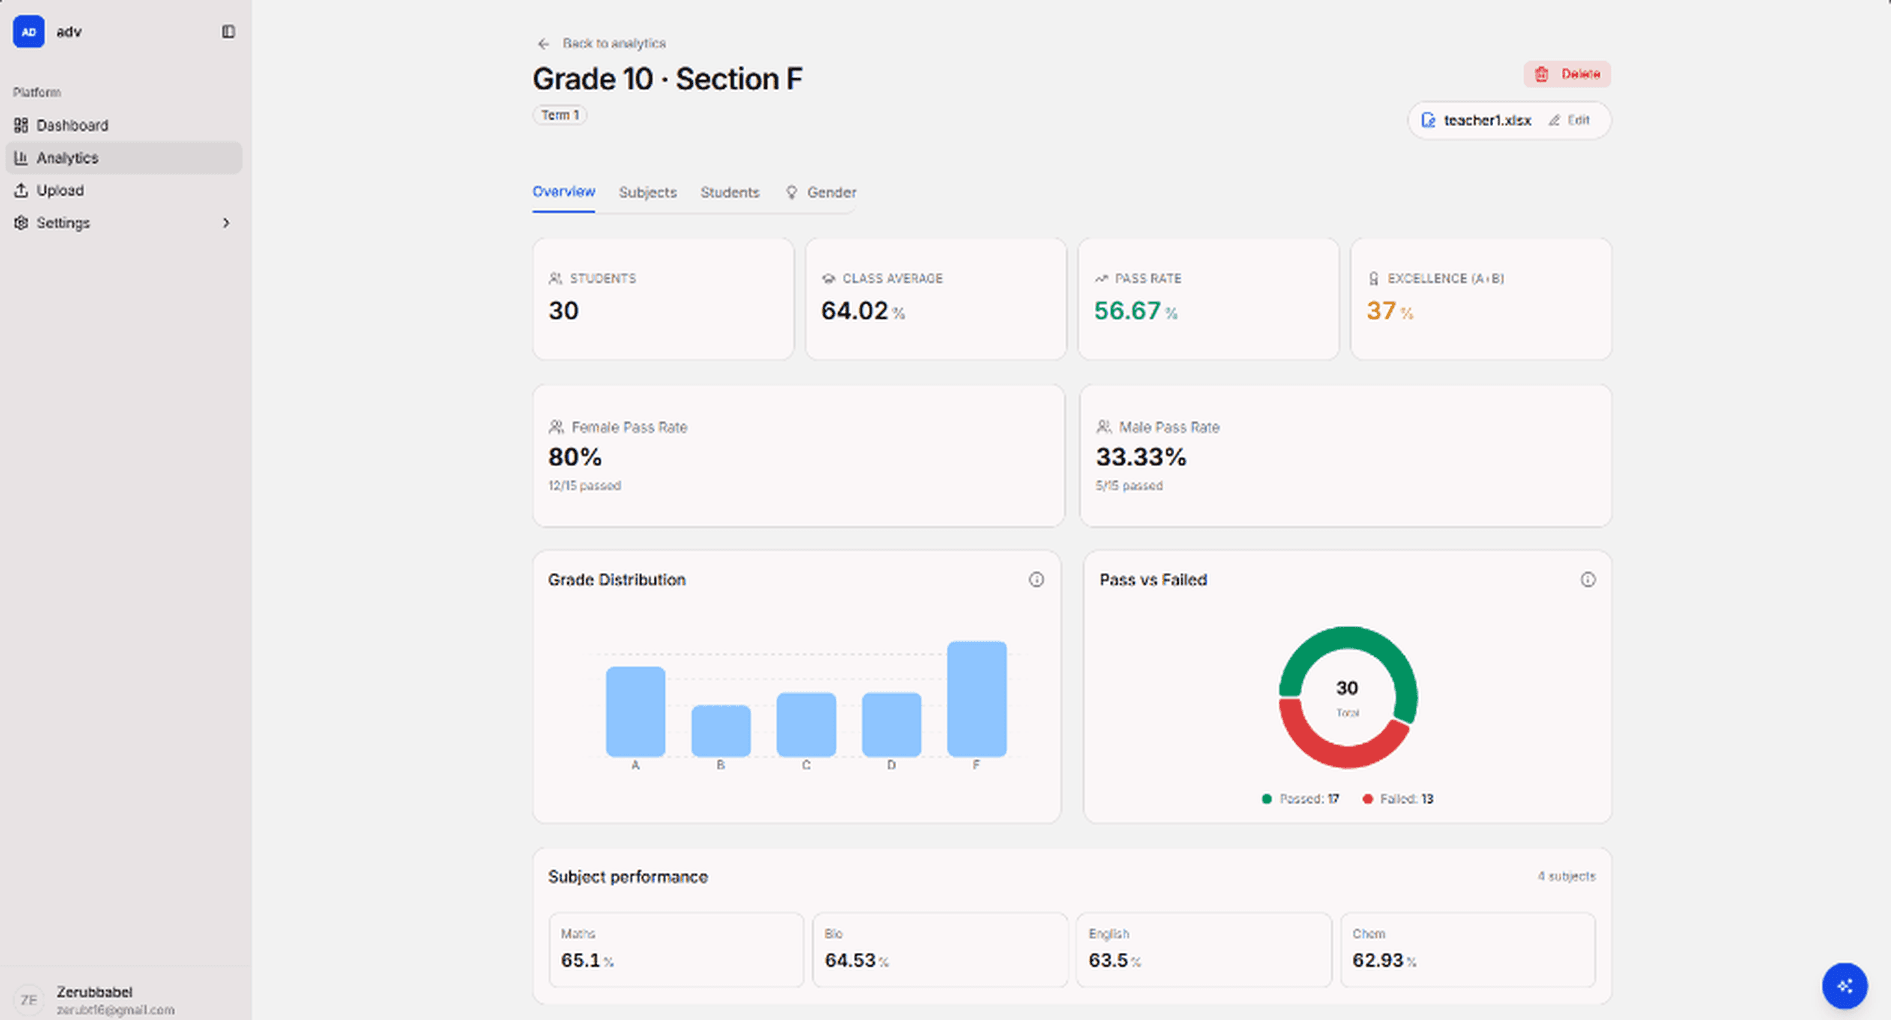
Get an instant look at class averages, overall pass rates, grade distributions, and gender performance metrics. Toggle between different streams and terms to spot patterns and trends.
- Visual grade distribution histograms
- Deep gender-gap performance analyses
- Compare terms and streams side-by-side
One source of truth for school leadership.
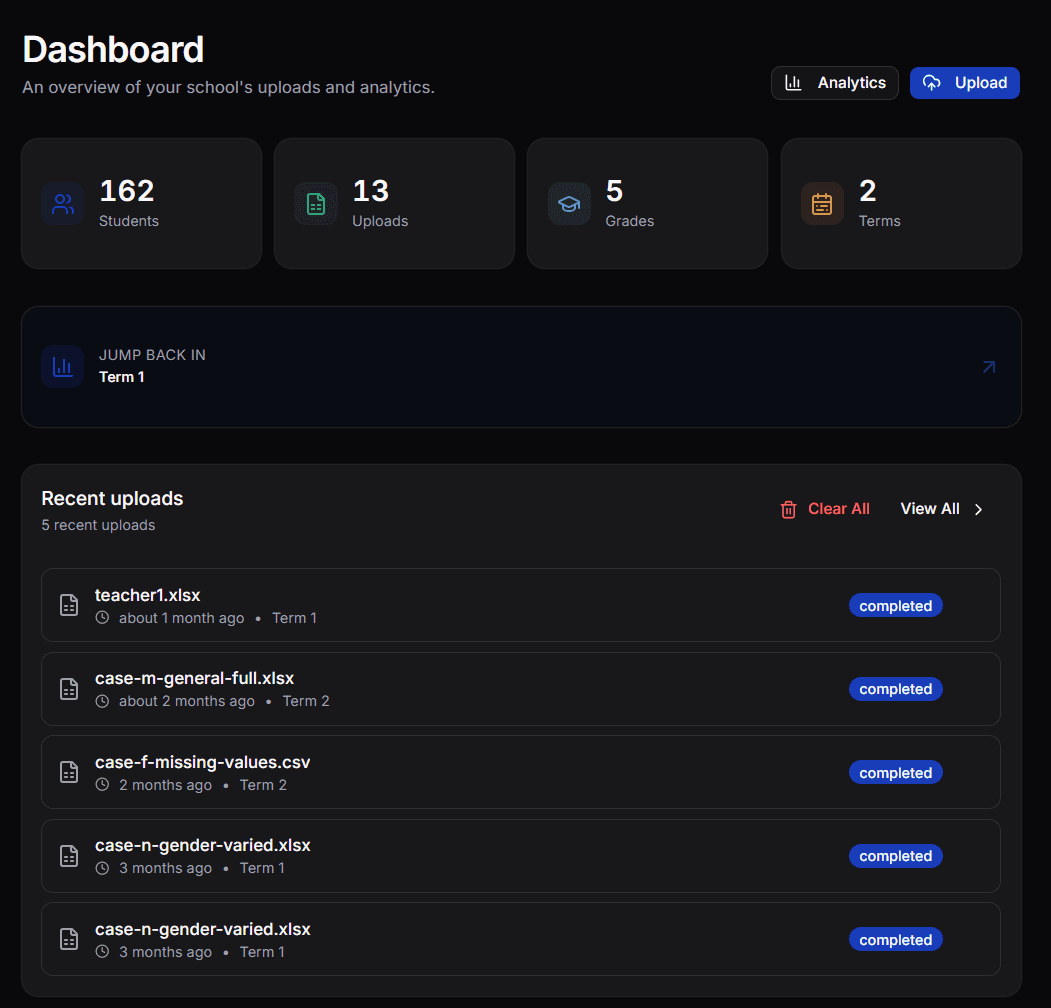
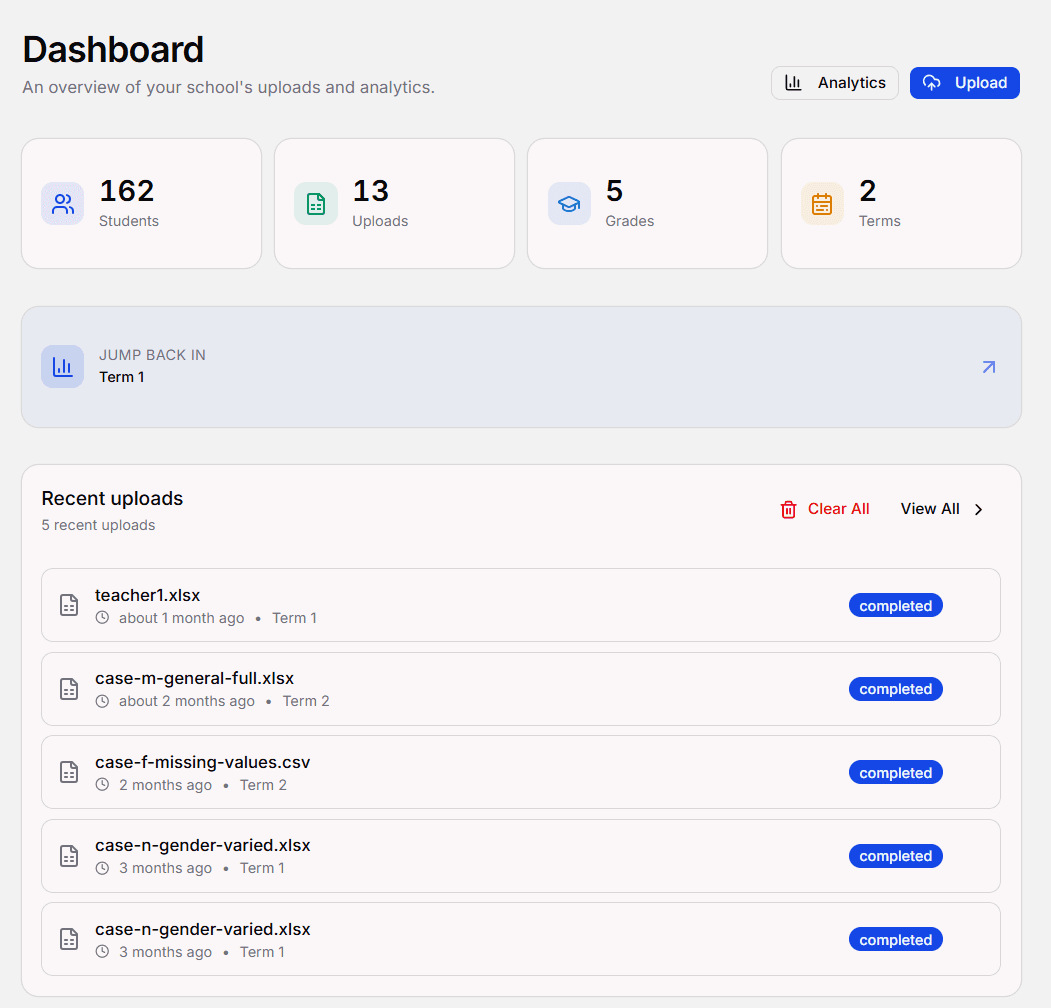
Admins get a unified view of all student records, term statistics, and recent uploads. Monitor which classes have finalized their grades, review student performance trajectory, and download board-ready reports in one click.
- View overall student progress metrics
- Audit trails of recent grade sheet uploads
- Secure role-based dashboard views
Skip the pivot table. Ask the question.
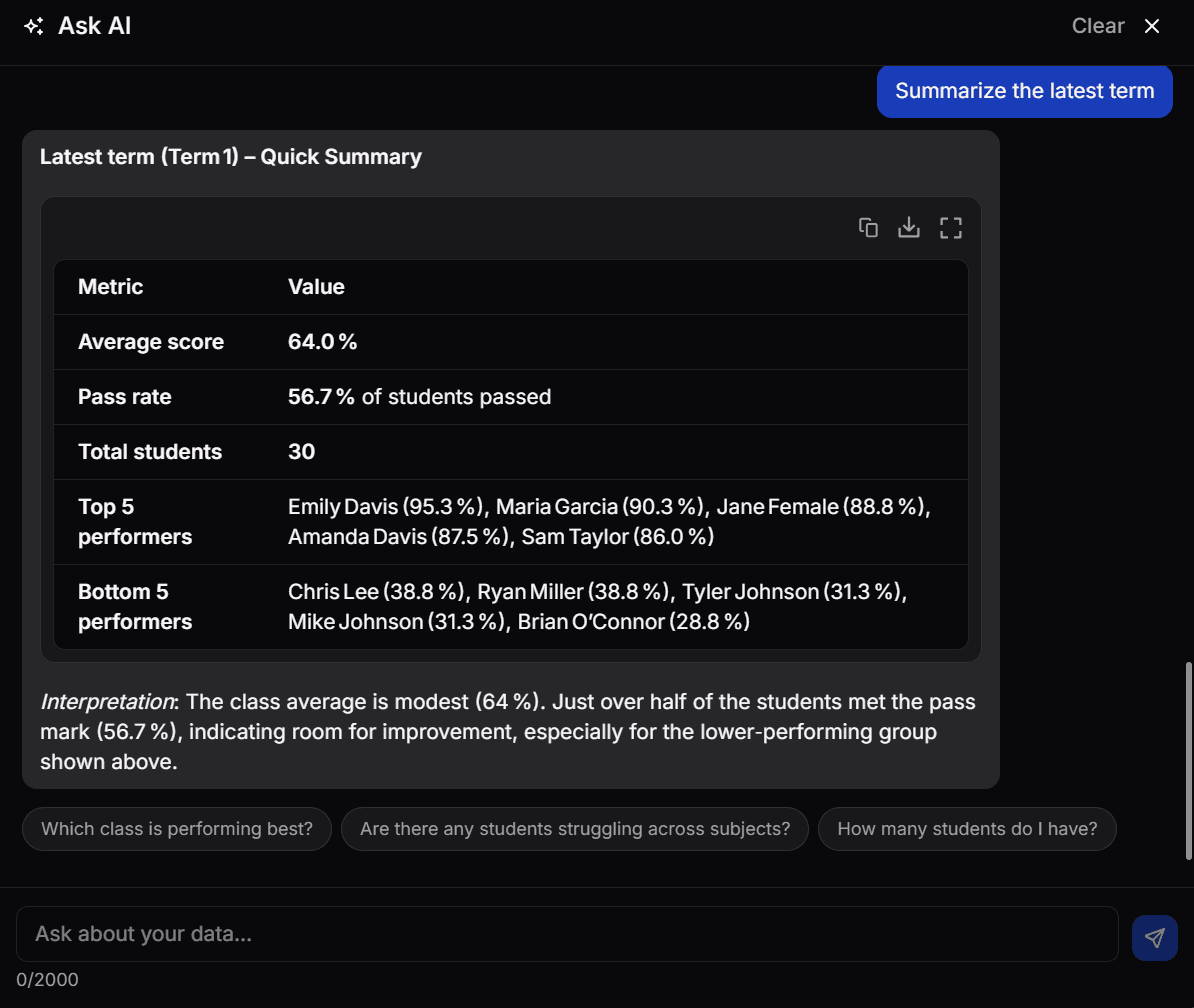
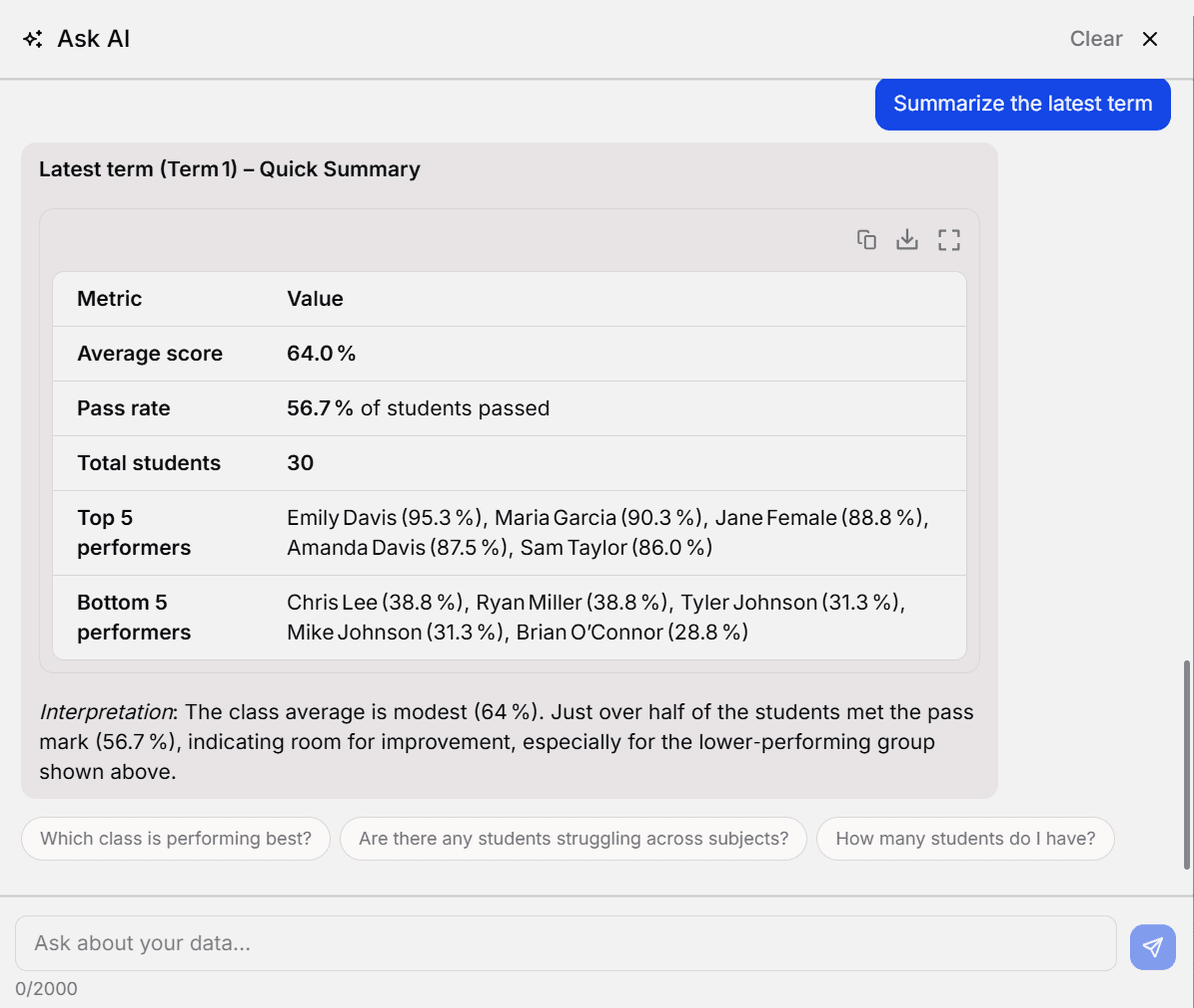
Every SmartGrader school gets an assistant trained on their own upload history. These are real questions teachers ask on day one.
- AskWhich students dropped more than 10% in maths this term?
- AskShow the bottom 5 performers in Grade 8 English.
- AskCompare 10A and 10B averages across science subjects.
- AskWhich subject has the widest gender gap this year?
- AskList students who improved in every subject since last term.
Built to replace the week you spend crunching sheets.
One dashboard, every stat that matters
Total students, pass rates, recent uploads, term-on-term movement. The numbers your head of school asks about every Monday.
Analytics that answer real questions
Class averages. Subject breakdowns. Gender comparisons. Top and bottom performers per stream, per term, per subject.
Ask questions in plain English
A built-in assistant reads your data. “Which students dropped more than 10% in maths this term?” gets an answer, not a formula.
Exports that go straight to the board
One click for a term comparison across classes, formatted in Excel. Bring it to the meeting; keep the credit.
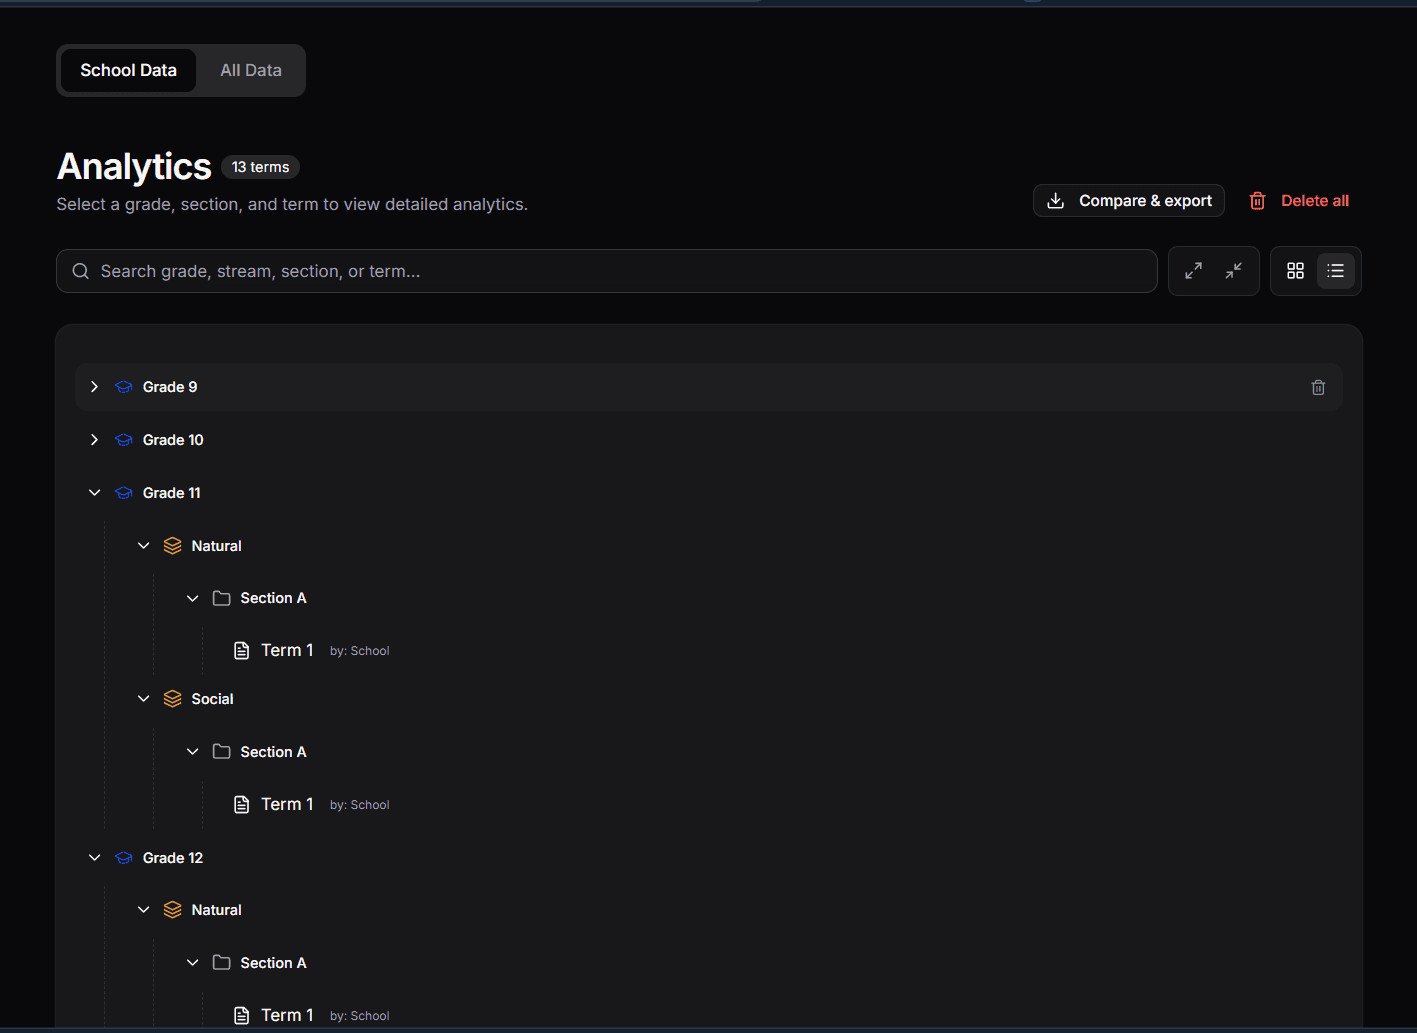
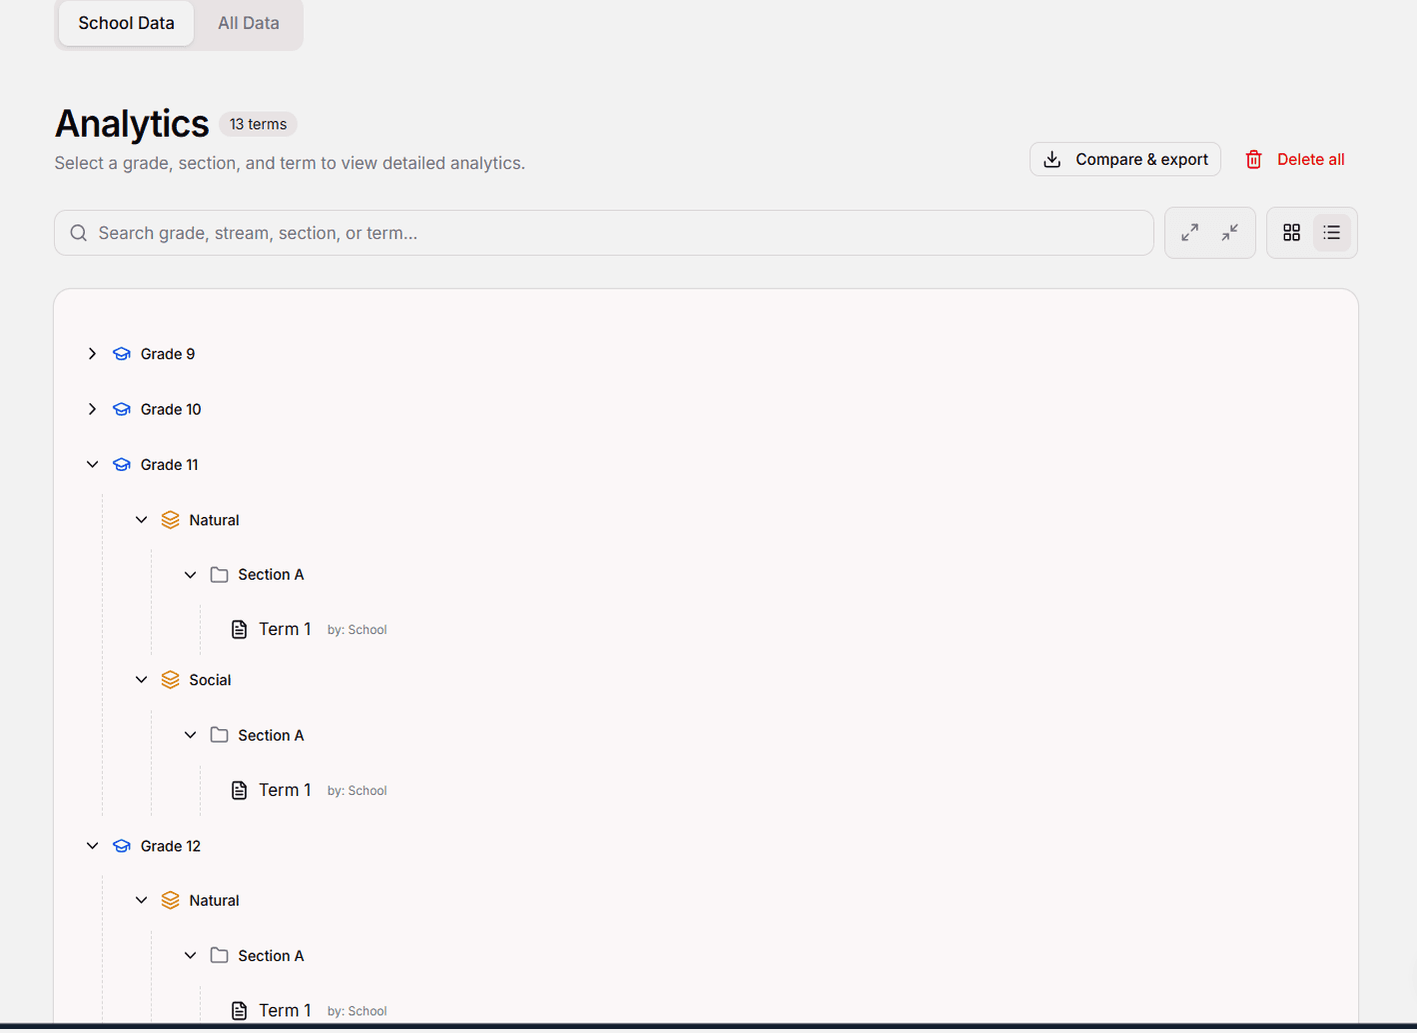
Admins run the school. Teachers run their classroom. Same data.
School admin
- Set up the school and grading rules
- Invite and manage teachers
- See every class, subject, and term at a glance
- Export board-ready reports
Teacher
- Upload exam results in seconds
- Track your own class over time
- Compare against the school average
- Spot struggling students before term ends
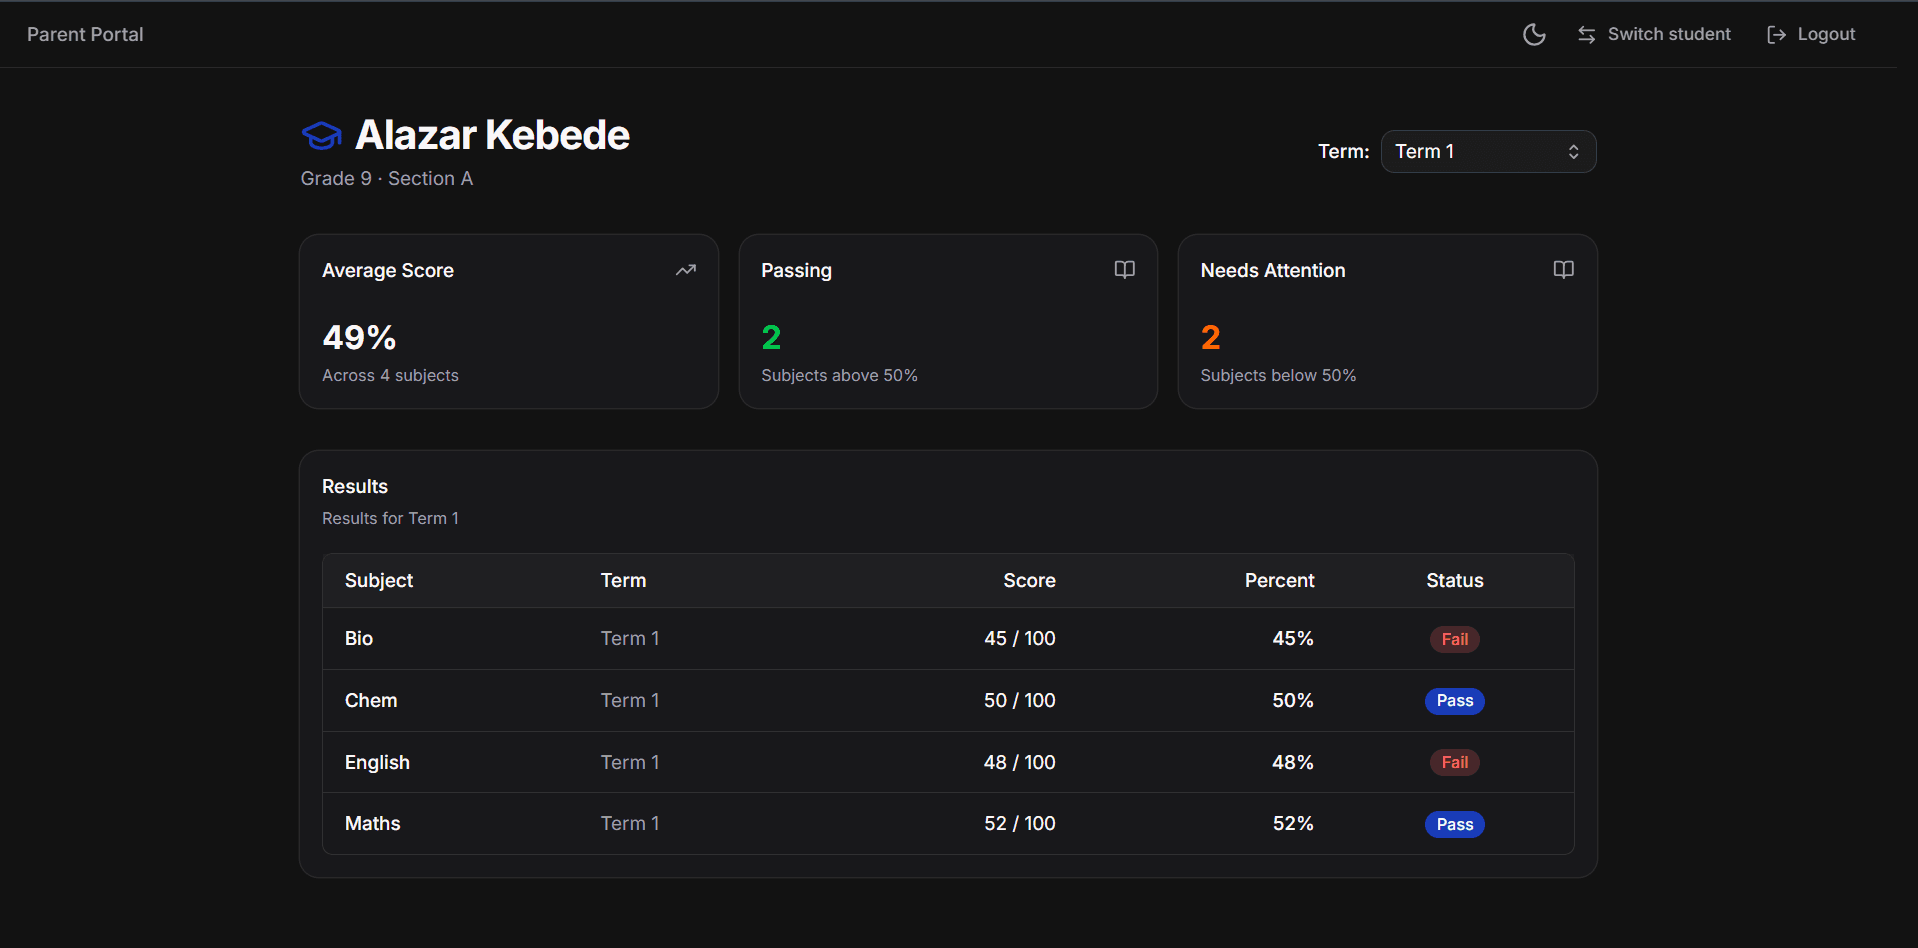
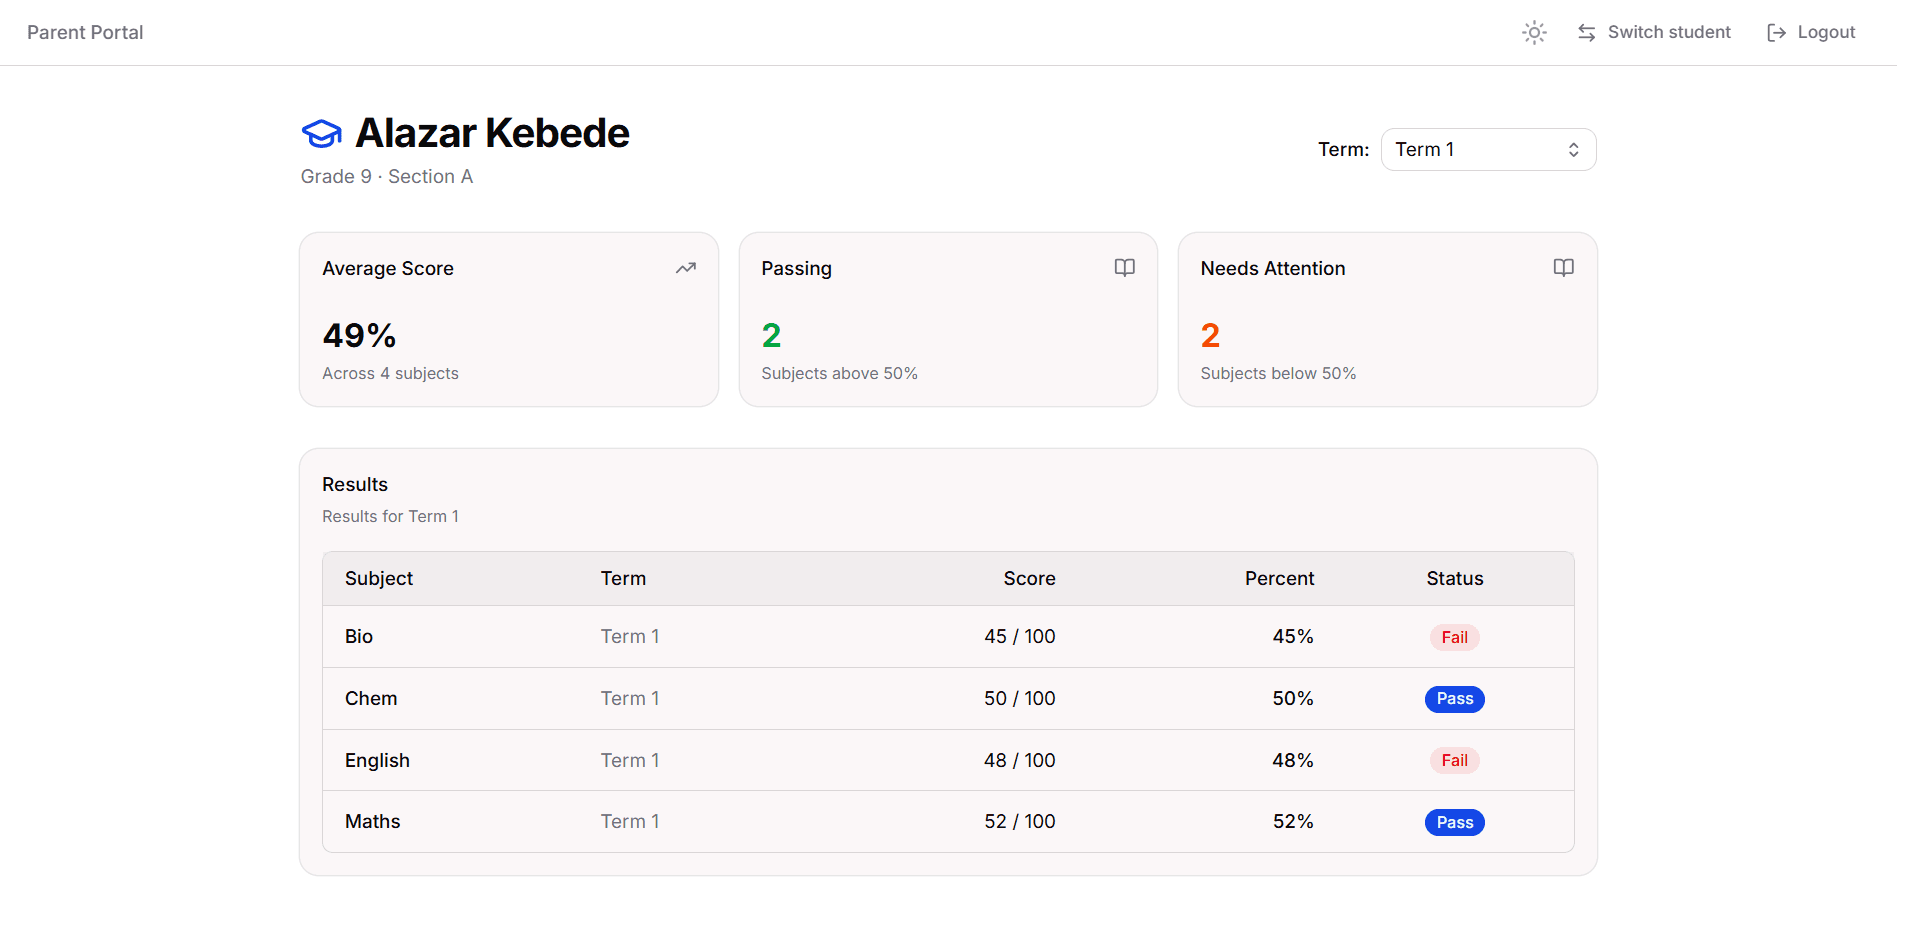
Parents see their child's progress. Nothing else.
Schools share a signup link. Parents create an account, enter their child's student ID, and land on a clean score view — no sidebar, no org context, no noise. Just the results that matter to them.
- Subject-by-subject scores per term
- Pass / fail status at a glance
- Link multiple children with separate IDs
- Read-only — parents can never modify data
We used to find out a student was failing at the parent meeting. Now we know by the second upload of the term.
No. SmartGrader detects your columns automatically and confirms the mapping the first time. After that it’s a drag-and-drop.
Your school does. Everything you upload is scoped to your school, exportable at any time, and deletable in one click.
That’s the default. Admins can widen access per role — teachers can see school-wide analytics, but not edit other teachers’ uploads.
A single flat rate per school, per year — no per-student fees. Book a call and we’ll size it for your intake.
Any level that uses marks — primary through sixth form. The system is subject-agnostic, so it works for sciences, humanities, languages, and everything in between.
Yes. SmartGrader reads the same .xlsx or .csv files your SIS already exports. No custom integration needed — just drag in the file.
Yes. Data is encrypted at rest and in transit, scoped only to your school, and never shared. You can export or delete everything at any time.
Upload one file.
See your school clearly.
Set up your school in ten minutes. Free while you're evaluating — bring one term of data and see if it earns a spot in your workflow.